Start with comparable records
Choose a period and check which flights have both planned and actual values. A change in coverage can change the apparent result.
Follow flight records and documents in FLIGHT AI. Give the operation a shared daily view with PINAX, and build dashboards around your assigned data with Vision Ai.
FLIGHT AI, PINAX, and Vision Ai are independent products. Choose the source record and decision you need to support.
| Job | Product | Output to review |
|---|---|---|
| Review a return document or fuel variance | FLIGHT AI | Extracted fields alongside source documents, flight records, and planned-versus-actual fuel measures. |
| Follow the operating day and explain punctuality | PINAX | A shared wallboard, flight-level detail, historical comparisons, and management briefs. |
| Build a dashboard around an assigned dataset | Vision Ai | A reviewed dashboard version and PDF reports built from datasets or published widgets. |
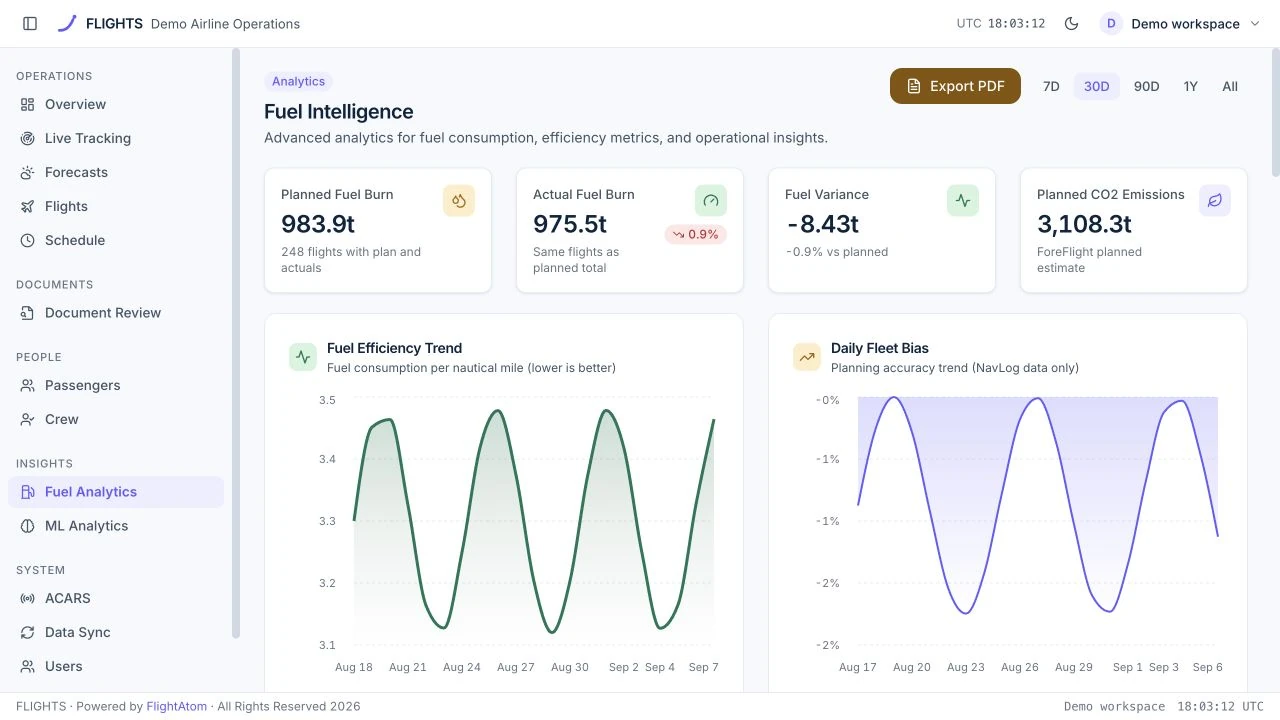
In FLIGHT AI, compare the same set of flights, inspect fuel variance, and read trends over the selected period. The current interface below uses demonstration data.
Choose a period and check which flights have both planned and actual values. A change in coverage can change the apparent result.
Use the document-review workflow to compare extracted information with its source and resolve fields that need human review.
Bring the flight, source values, and variance into the review, rather than treating an aggregate trend as an operational instruction.
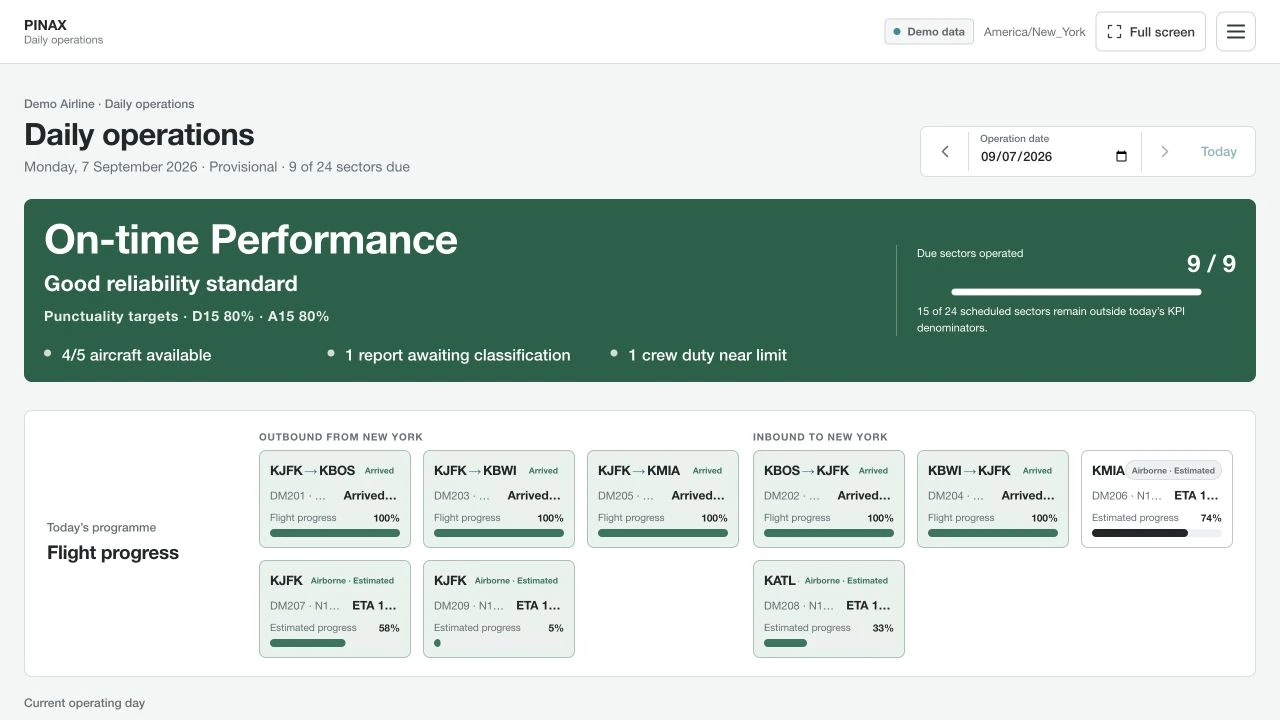
PINAX puts daily flight progress and performance in one view. Use historical analysis to examine punctuality, delays, and the denominator behind a management question. Actual interface; demonstration data.
Begin with the shared wallboard and the relevant flight or period.
Review flights and delay evidence before drawing a conclusion from a headline measure.
Keep the selected period, measure definition, source coverage, and management finding together.
Vision Ai lets an authorised user create and refine a dashboard from assigned data, then publish a reviewed version and prepare PDF reports.
Describe a chart, refine it with visible controls, and check the figures before publication.
Explore the workflow ↗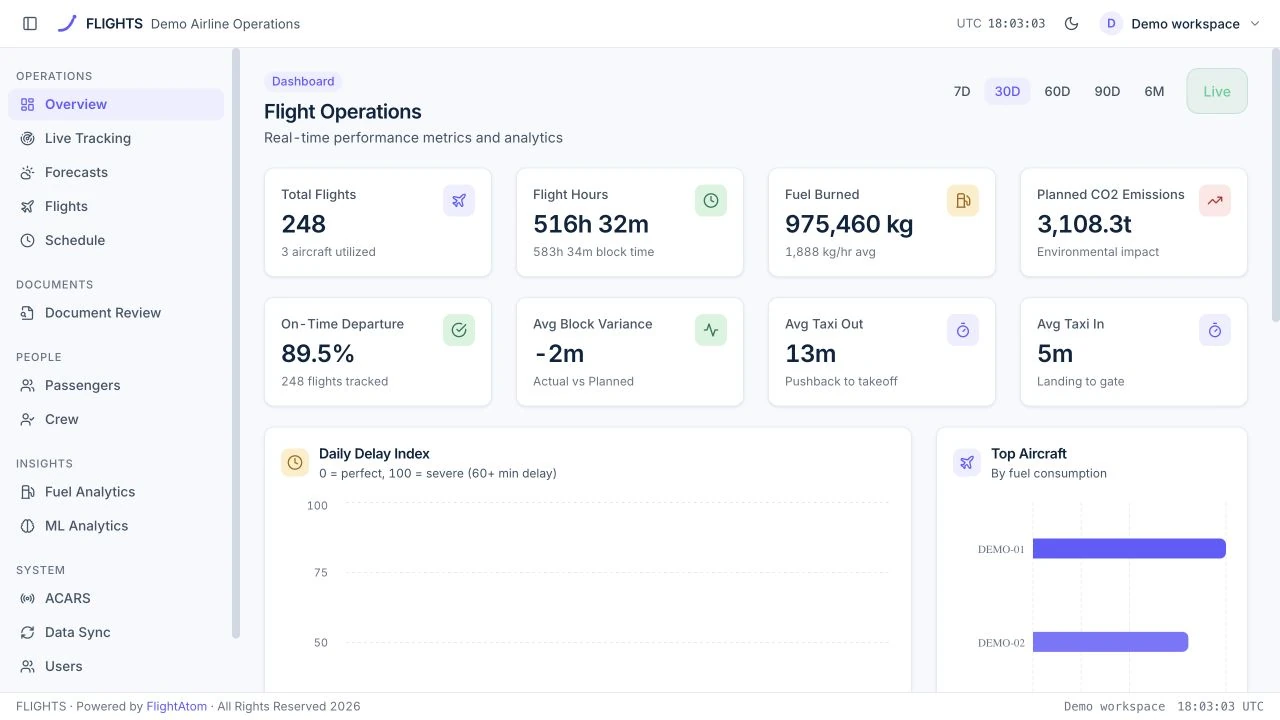
Flight records, fuel intelligence, document extraction, and operational forecasts.
Put the operating day, flight progress, punctuality and delay causes in one view, then move into historical analysis and management briefs.
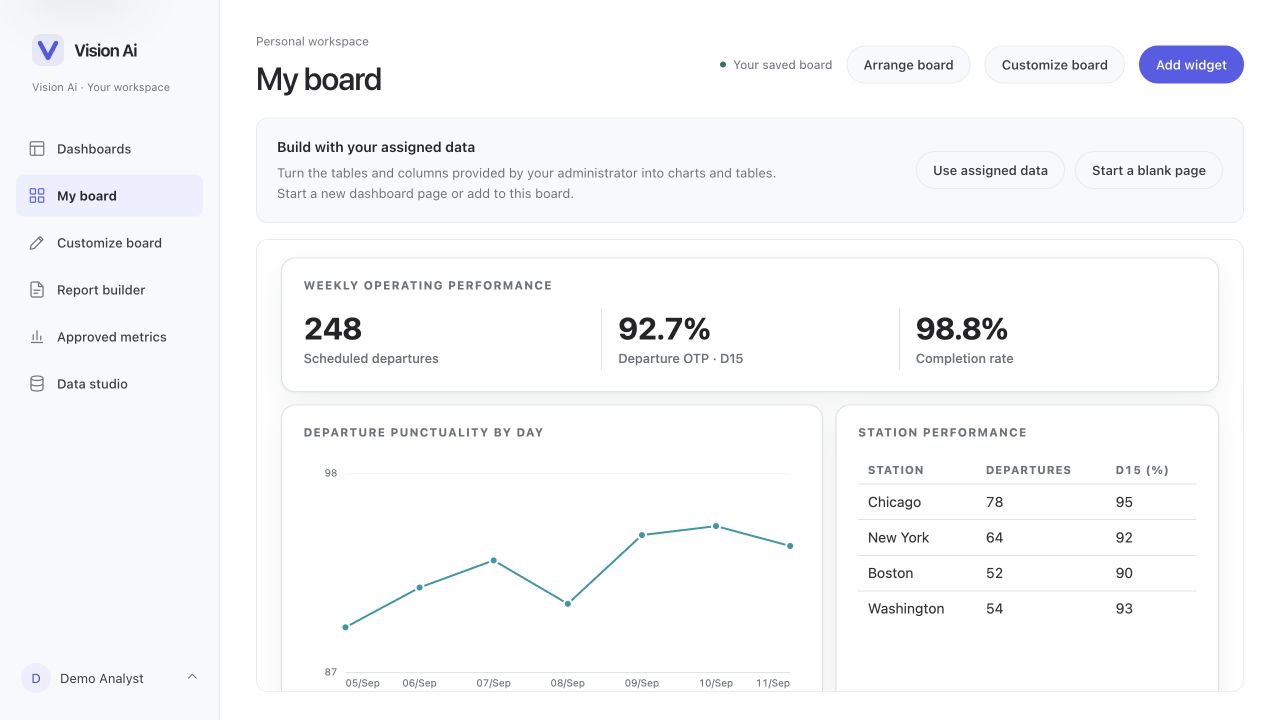
Build and refine dashboards with AI, publish reviewed versions, and reuse widgets in PDF reports.
A focused walkthrough, with the people and decisions that matter to your team.