01 / Vision Ai
Read a dashboard built around your work
Bring the charts, metrics, and supporting records for a reporting question into one personal dashboard.
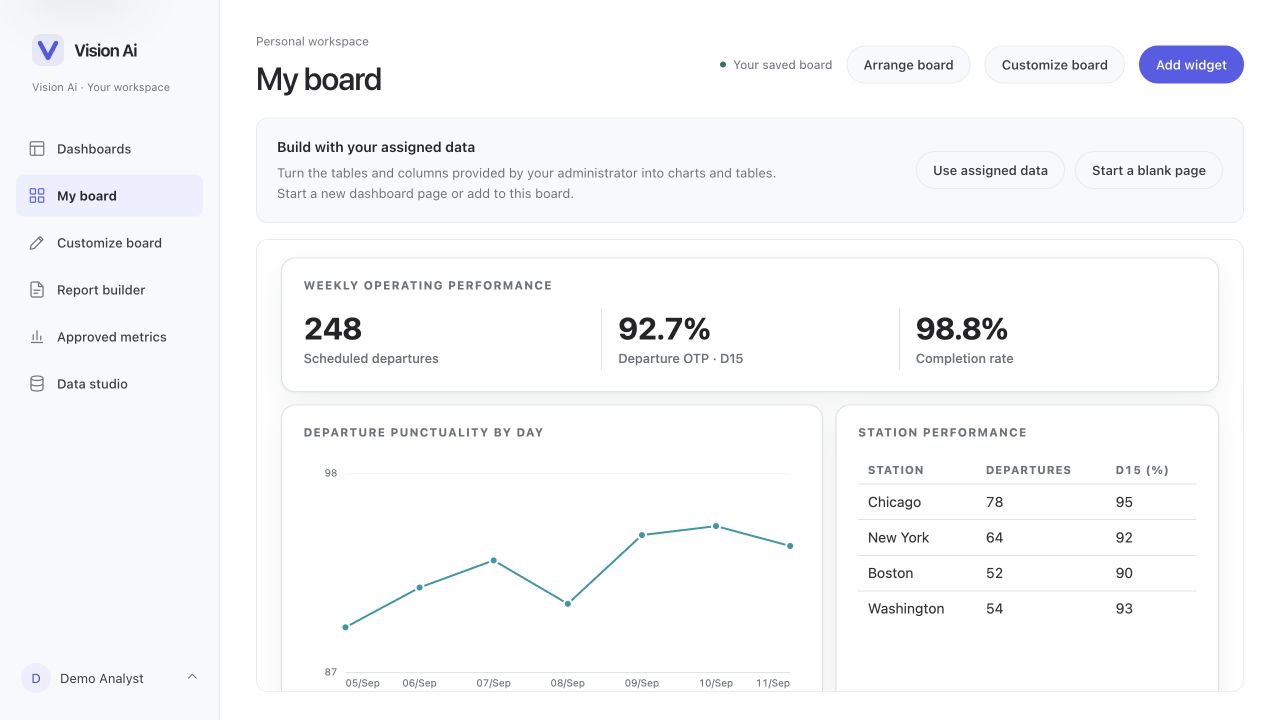
Turn the data your team can access into a dashboard built around its questions. Create charts, tables, metrics, and interactive components with AI, refine them with visible editing controls, and publish the version you want to use.
Email me the brochure (PDF · 6.5 MB)A team needs a dashboard for a recurring reporting question. The administrator has assigned the relevant data, and the owner needs a view that can be checked and maintained.
Choose the data available to your role and the measures the dashboard needs to explain.
Describe a chart or component, inspect the result, and adjust it with AI or visible editing controls. Undo and redo keep refinement in the same draft.
Check the figures and the view, then publish the dashboard. Keep version history and reuse published widgets in a PDF report.
A published dashboard version, with a saved editing history and widgets that can be reused in reports.
The dashboard owner checks the interpretation and figures before publication. Administrators determine the data each user can access.
Current product interfaces with synthetic demonstration data and adapted Vision Ai presentation branding. Open an image to inspect the workspace.
Bring the charts, metrics, and supporting records for a reporting question into one personal dashboard.
Focus a request on a page or widget and use visible controls to refine the same dashboard draft.
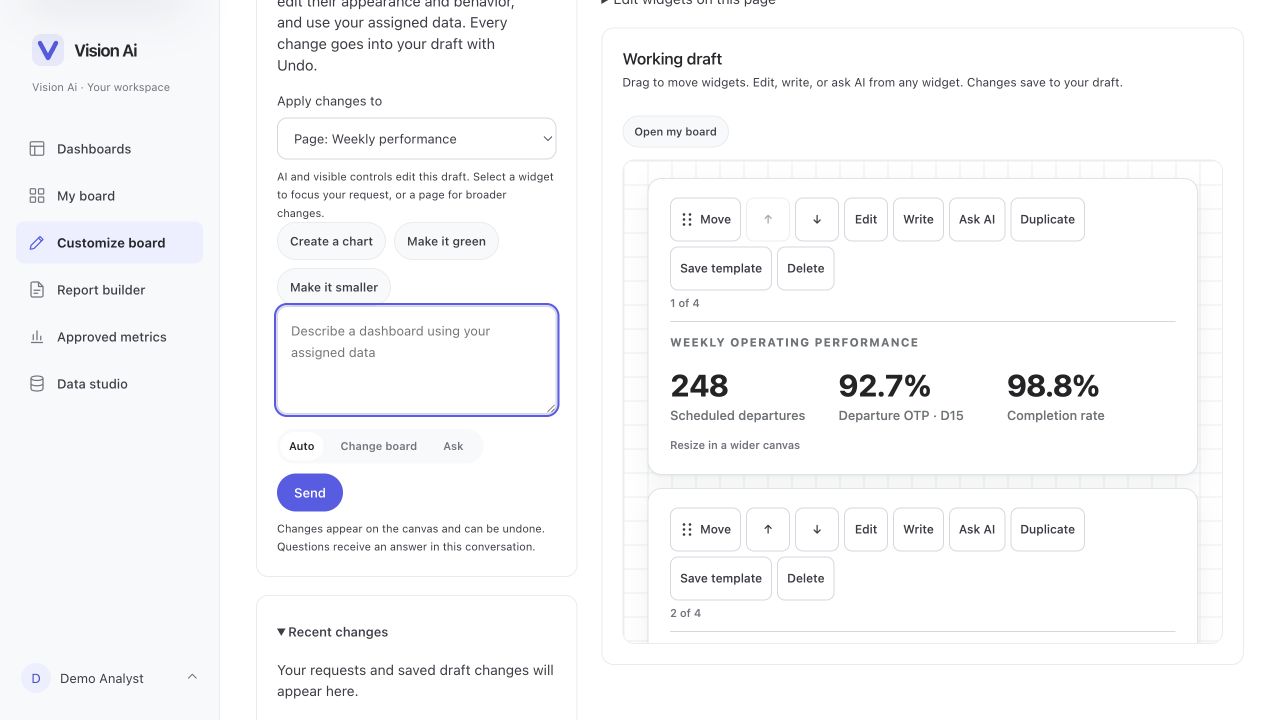
Build and refine dashboards with AI, publish reviewed versions, and reuse widgets in PDF reports.
Work with tables, columns, and rows made available by an administrator. Build reusable datasets for the dashboards and reports your team needs.
Use AI to create or refine native charts, tables, metrics, and custom interactive components around a specific reporting question.
AI changes and visible editing controls work on the same autosaved dashboard draft. Adjust the layout, inspect the result, and use undo or redo as you refine it.
Review your draft and publish the dashboard explicitly. Keep version history available when you need to revisit or restore earlier work.
Administrators define and version business metrics, including their calculation and time basis. Reuse those definitions instead of recreating the same measure in each dashboard.
Administrators can publish shared dashboards. Each reader sees the data permitted by their own assigned access.
Build reports from datasets or published dashboard widgets. Preview and download the result, then configure scheduled delivery with fresh data and access checks.
Vision Ai combines generative dashboard assistance with visible controls, validated data access, and an explicit publication step.
Describe the view you need or select a component and ask for a change. Successful AI edits update the same draft used by the manual controls.
For approved PostgreSQL and Snowflake connections, plain-language exploration proposes a query you can preview and refine before using its results.
Dataset specifications and data bindings are validated against assigned access. Business metric definitions, permission checks, and report generation remain explicit controls.
Agree a representative sample and a baseline from your current process. These are proposed evaluation measures, not published performance results.
An approved sample dataset, a reporting question, and the dashboard your team uses today.
Build and refine a dashboard draft, check the figures and data permissions, publish a version, and reuse a widget in a PDF report.
Dashboard preparation time; agreement with reference calculations; reviewer corrections; report preparation time.
PINAX provides a shared operational wallboard and performance analysis. Vision Ai is a separate workspace for building, refining, sharing, and reporting from dashboards tailored to your data and questions.
No. Vision Ai is an independent product with its own dashboard, data-access, and reporting workflows.
Yes. Visible editing controls and AI work on the same autosaved draft. You can adjust widgets and layout, undo or redo changes, and publish when you are ready.
No. AI changes update the draft. Publish dashboard is the explicit step that makes the reviewed version the published dashboard.
The implementation includes PostgreSQL, MySQL, MongoDB, and Snowflake connections. Plain-language query exploration currently supports PostgreSQL and Snowflake. Administrators control the data available to each user.
Yes. Reports can use datasets or published dashboard widgets. You can preview and download the PDF, or configure scheduled delivery with refreshed data and access checks.
A focused walkthrough, with the people and decisions that matter to your team.